HMO vs Single-Let: The Real After-Tax Comparison
HMOs gross more — but bills-included costs, HMO licence fees, fire safety, and Article 4 planning friction take a real bite. We compare HMO and single-let on a like-for-like after-tax basis at typical UK numbers.
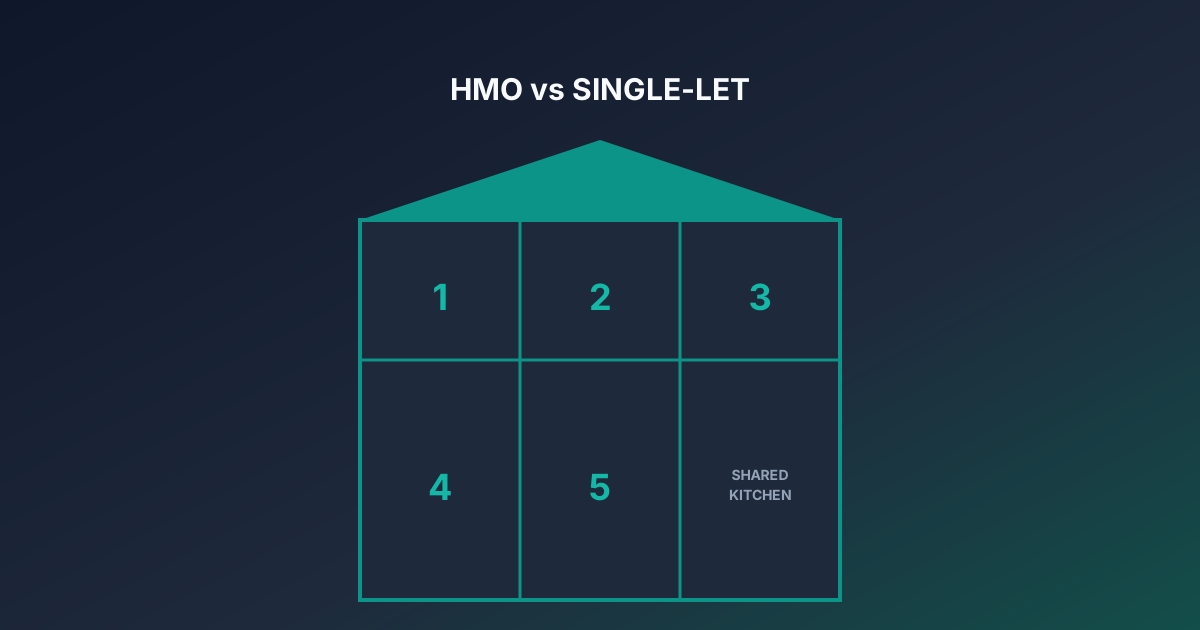
HMOs gross much more than single-lets — often 1.8–2.5× the rent per property. But the model is fundamentally different: bills-included costs, HMO licence, fire safety, higher management, and tighter ICR thresholds. Once Section 24 lands on top, the after-tax delta is much smaller than the gross delta suggests.
Like-for-like example
£280,000 house, £210,000 BTL mortgage at 6% interest-only. Higher-rate landlord.
| Single-let | 5-room HMO | |
|---|---|---|
| Monthly gross | £1,500 | £3,000 |
| Annual gross | £18,000 | £36,000 |
| Bills & compliance | — | −£10,440 |
| Mortgage interest | −£12,600 | −£12,600 |
| Op costs | −£1,500 | −£3,000 |
| Pre-tax cash | £3,900 | £9,960 |
| Section 24 tax | −£3,720 | −£8,640 |
| After-tax cash | £180 | £1,320 |
The HMO produces ~7× more after-tax cash, but on the back of much more management intensity, Article 4 planning friction, and HMO licensing risk.
Other things to watch
- Many councils require HMO planning under Article 4 direction. Check first.
- HMO mortgages stress at 125–175% ICR depending on lender — tighter than standard BTL.
- Above 7 rooms or 3 storeys you may need commercial valuation, not bricks-and-mortar.
Use the HMO Deal Analyser to model room rents, bills, occupancy break-even and the direct HMO-vs-single-let after-tax comparison on your specific deal.